UK house prices have risen by 377% while Queen Elizabeth II has been on the throne
Research from national UK estate agent, Keller Williams UK, has found that UK house prices have, once adjusted for inflation, risen by 377% since the Queen’s coronation in 1953, while the past 12 months have brought mixed fortunes for Her Majesty’s impressive property portfolio.
When Queen Elizabeth II was crowned on 2nd June 1953, the average UK house price was £1,884 which, when adjusted for inflation, is £53,794 in today’s money. Now, almost 70 years later, the average UK house price is £256,405; an impressive rise of 377%.
The UK nation with the largest price rise is England, where today’s average of £274,615 is up 436% from 1953, while the smallest rise has come from Northern Ireland, where today’s average house price of £149,178 is 193% higher than it was at the time of the coronation.
The Queen, along with the rest of the extended Royal Family, boasts a very impressive property portfolio that contains some of the UK’s most historic and beautiful residencies, from Highland castles to Chelsea palaces.
Just like the rest of the UK housing market, this property portfolio has endured a difficult 12 months as the world battles with COVID-19.
When all of the Queen’s properties, including those owned by The Crown and those owned privately by the Queen, are studied for performance over the past 12 months, there is almost a 50/50 split between those that have seen their value increase, and those that have seen it decline.
The Queen’s best-performing property is Bagshot Park, a sprawling Royal estate in Surrey Heath, has enjoyed the strongest growth in value since March 2020, with the average price for a home in its GU19 postcode rising 19% to £480,423.
This is followed by two more Royal residencies, Sandringham House and Anmer Hall, both of which are located in the PE35 postcode of King's Lynn and West Norfolk area where house prices have enjoyed a 17% annual rise to currently sit at £343,018.
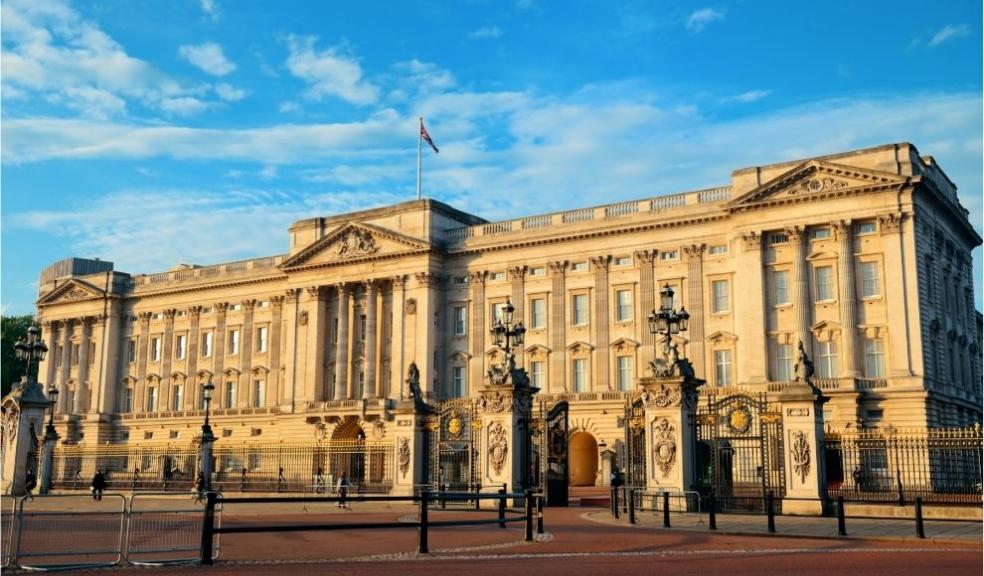
But it’s not all profit and boom - even Her Majesty the Queen cannot sidestep economic fluctuation and so 12 of her Royal homes have decreased in value since March 2020. Nowhere is this more true than those residencies located in the City of Westminster. Buckingham Palace, Clarence House, and St. James’s Palace are all in the SW1A postcode where house prices have decreased by -15% since March 2020, to an average of £1,317,359.
CEO of Keller Williams UK, Ben Taylor, commented:
“Queen Elizabeth’s reign continues to be mightily impressive for a multitude of reasons, not least the way in which relative stability has been maintained through some of the UK’s most troubled moments in history, including wars, economic crashes, and catastrophic global events. A 377% increase in house prices is just one point that illustrates this fact.
“As for the Queen’s enviable portfolio - it spans almost every corner of the UK and so acts as an informative microcosm of the UK market’s ups and downs since COVID-19 attacked. We see Her Majesty’s regional homes in the likes of Scotland and Norfolk performing well, while her London residencies have lost significant value were they, in some bizarre twist of events, to be sold on the open market.
“But the Queen needn’t lose too much sleep, nor do I believe should any London homeowners. The capital’s market is famously resilient, so this past year’s drop in value should soon be regained as the pandemic becomes one more event on Her Majesty’s timeline of historic events.”
|
Location |
Coronation |
Inflation adjusted - estimated values |
||
|
AveHP - 1953 |
AveHP - 1953 |
AveHP - 2021 (March) |
Change % (1971 to 2021) |
|
|
United Kingdom |
£1,884 |
£53,794 |
£256,405 |
377% |
|
|
|
|
|
|
|
England |
£1,796 |
£51,281 |
£274,615 |
436% |
|
Wales |
£1,484 |
£42,373 |
£185,431 |
338% |
|
Scotland |
£1,501 |
£42,858 |
£166,566 |
289% |
|
Northern Ireland |
£1,784 |
£50,939 |
£149,178 |
193% |
|
House price data sourced from Nationwide and Gov.uk |
||||
|
|
|
|
|
|
|
Royal residence |
Type |
Local authority info |
Postcode |
Current Average House Price |
Annual Change (%) |
|
Bagshot Park |
Crown |
Surrey Heath |
GU19 5PJ |
£480,423 |
19% |
|
Sandringham House |
Private |
Kings Lynn and West Norfolk |
PE35 6EN |
£343,018 |
17% |
|
Anmer Hall |
Private |
Kings Lynn and West Norfolk |
PE31 6RN |
£343,018 |
17% |
|
Llwynywermod |
Duchy of Cornwall |
Carmarthenshire |
SA20 0NQ |
£279,995 |
11% |
|
Palace of Holyroodhouse |
Crown |
Edinburgh |
EH8 8DX |
£229,350 |
6% |
|
Balmoral Castle |
Private |
Aberdeenshire |
AB35 5TB |
£168,558 |
2% |
|
Craigowan Lodge |
Private |
Aberdeenshire |
AB35 5TB |
£168,558 |
2% |
|
Birkhall |
Private |
Aberdeenshire |
AB35 5SU |
£168,558 |
2% |
|
Thatched House Lodge |
Crown |
Richmond upon Thames |
TW10 5HP |
£799,518 |
2% |
|
Gatcombe Park |
Private |
Stroud |
GL6 9BG |
£436,777 |
-4% |
|
Highgrove House |
Duchy of Cornwall |
Cotswold |
GL8 8TN |
£376,649 |
-5% |
|
Kensington Palace |
Crown |
Kensington and Chelsea |
W8 4PX |
£1,822,594 |
-5% |
|
Ivy Cottage |
Crown |
Kensington and Chelsea |
W8 4PY |
£1,822,594 |
-5% |
|
Wren House |
Crown |
Kensington and Chelsea |
W8 4PY |
£1,822,594 |
-5% |
|
Barnwell Manor |
Private |
East Northamptonshire |
PE8 5PJ |
£368,920 |
-8% |
|
Windsor Castle |
Crown |
Windsor and Maidenhead |
SL4 1NJ |
£499,373 |
-11% |
|
Frogmore Cottage |
Crown |
Windsor and Maidenhead |
SL4 2JG |
£499,373 |
-11% |
|
The Royal Lodge |
Crown |
Windsor and Maidenhead |
SL4 2JD |
£499,373 |
-11% |
|
Buckingham Palace |
Crown |
City of Westminster |
SW1A 1AA |
£1,317,359 |
-15% |
|
Clarence House |
Crown |
City of Westminster |
SW1A 1BA |
£1,317,359 |
-15% |
|
St James's Palace |
Crown |
City of Westminster |
SW1A 1BQ |
£1,317,359 |
-15% |
|
Hillsborough Castle and Tamarisk excluded due to lack of available postcode house price data |
|||||


