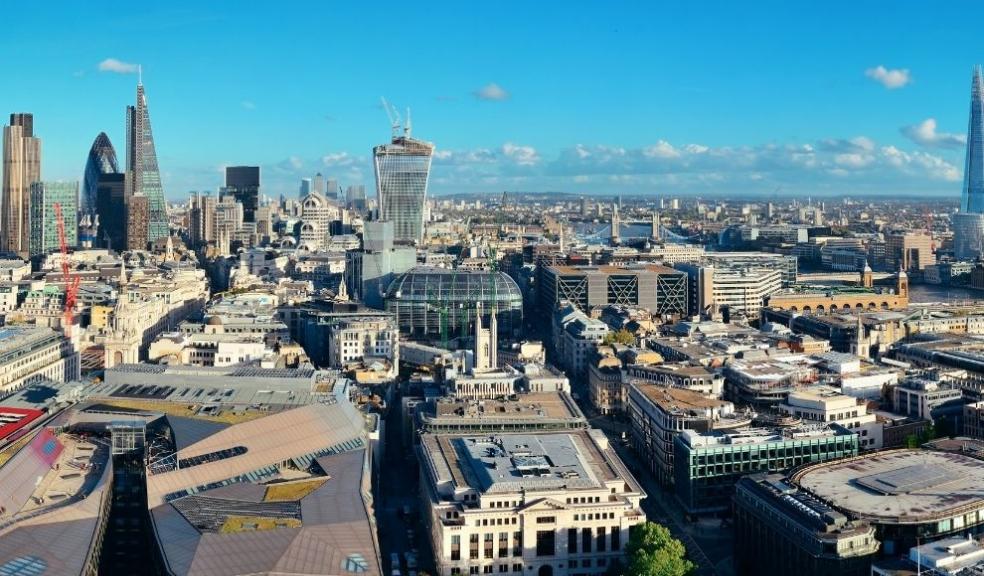
Prime London market accounts for 12% of London property sales so far in 2021
Research by central London estate agency, Bective, has revealed areas of the prime London market that have been most active in 2021 based on both price threshold and location.
Bective’s analysis of Land Registry sold price records dissects the market based on the number of transactions seen at £1m-£3m, £3m-£5m and £5m+ across each borough.
The research shows that across all segments of the prime market, 3,381 transactions have taken place during the first half of this year, accounting for 12% of all London property sales.
The core market - £1m-£3m
The core prime market has been the most active during the first six months of the year, accounting for 10.8% of the 28,210 homes sold across London so far this year.
With an average sold price of just over £1.3m, properties at this tier of the market are selling for 153% more than the London average.
Kensington and Chelsea has seen 197 transactions complete at this rung of the market, accounting for 39% of the 508 homes sold in the borough in 2021.
Hammersmith and Fulham (34%), Westminster (33%) and Camden (30%) have also seen 30% or more of homes sold in their respective boroughs do so for between £1m and £3m, while in Richmond and Islington a quarter of transactions sit within this price range.
The mid-market - £3m+ to £5m
Across the mid-prime market, 214 transactions have completed so far this year equating to just 0.8% of all London transactions. With an average sold price of £3.65m, this segment of the market comes in some 609% more expensive than the London average.
While Kensington sits top with 11% of all homes sold at this price threshold again, Westminster ranks second with 8% of all transactions completed in the borough between £3m to £5m.
With just 4% of the overall transactions taking place at this level of the prime market, Camden also places above Hammersmith and Fulham (2%).
The prime market - £5m+
There have been just 117 homes sold over the £5m threshold so far in London this year, amounting to 0.4% of total transactions across the capital.
With an average sold price of £7.1m, the cost of purchasing within the prime market comes in at 1,279% higher than the average London home.
Only 12 out of the 32 boroughs have seen transactions at this price point this year, with just five boroughs seeing more than a handful of sales.
In Kensington and Chelsea, 54 homes have sold for more than £5m in 2021, accounting for 11% of all homes sold in this borough.
Westminster (6%) and Camden (2%) again rank high, along with Merton (0.4%) and Richmond (0.3%).
Bective Revenues Director, Craig Tonkin, commented:
“Unlike much of the UK, London’s top tier property market hasn’t been hit by the same level of homebuyer hysteria as a result of the stamp duty holiday. However, that’s not to say it hasn’t played a part and market activity in the first half of this year has certainly benefited.
However, looking forward we expect the return of international interest to play a far more pivotal role over the remainder of the year.
We’ve already seen buyer registrations from all corners increase by 81% in the last month alone which is an extremely positive indicator.
Property values across the likes of Kensington and Chelsea and Westminster are also some twenty to twenty-five per cent off previous market peaks so there is still a strong level of growth potential.
When coupled with the fact that interest rates remain at an all-time low, we should see a strong finish to the year across much of the London market.”
|
General prime market - £1m to £3m |
||||||
|
Location |
All Transactions |
Transctions between £1m & £3m |
£1m to £3m as % of all |
Average sold price - All |
Average sold price - £1m to £3m |
Price difference (%) |
|
Kensington and Chelsea |
508 |
197 |
39% |
£1,200,000 |
£1,550,000 |
29% |
|
Hammersmith and Fulham |
612 |
209 |
34% |
£757,500 |
£1,435,000 |
89% |
|
City of Westminster |
561 |
184 |
33% |
£930,000 |
£1,366,250 |
47% |
|
Camden |
591 |
180 |
30% |
£762,000 |
£1,513,500 |
99% |
|
Richmond upon Thames |
1,035 |
267 |
26% |
£692,500 |
£1,350,000 |
95% |
|
Islington |
542 |
136 |
25% |
£650,000 |
£1,348,500 |
107% |
|
Wandsworth |
1,511 |
341 |
23% |
£662,500 |
£1,290,000 |
95% |
|
Barnet |
1,174 |
201 |
17% |
£610,000 |
£1,275,000 |
109% |
|
City of London |
37 |
6 |
16% |
£712,000 |
£1,121,300 |
57% |
|
Hackney |
683 |
108 |
16% |
£582,000 |
£1,237,500 |
113% |
|
Haringey |
700 |
103 |
15% |
£559,500 |
£1,350,000 |
141% |
|
Brent |
580 |
74 |
13% |
£563,125 |
£1,387,500 |
146% |
|
Southwark |
868 |
109 |
13% |
£567,500 |
£1,300,000 |
129% |
|
Lambeth |
1,107 |
139 |
13% |
£560,000 |
£1,295,000 |
131% |
|
Ealing |
812 |
101 |
12% |
£530,000 |
£1,375,000 |
159% |
|
Merton |
779 |
93 |
12% |
£548,000 |
£1,250,000 |
128% |
|
Hounslow |
635 |
60 |
9% |
£480,000 |
£1,348,750 |
181% |
|
Kingston upon Thames |
788 |
69 |
9% |
£546,000 |
£1,200,000 |
120% |
|
Tower Hamlets |
702 |
59 |
8% |
£510,000 |
£1,177,400 |
131% |
|
Harrow |
673 |
50 |
7% |
£550,000 |
£1,215,125 |
121% |
|
Bromley |
1,768 |
98 |
6% |
£500,000 |
£1,215,000 |
143% |
|
Enfield |
931 |
47 |
5% |
£473,000 |
£1,150,000 |
143% |
|
Lewisham |
1,065 |
47 |
4% |
£490,000 |
£1,250,000 |
155% |
|
Redbridge |
842 |
37 |
4% |
£490,000 |
£1,165,000 |
138% |
|
Greenwich |
882 |
35 |
4% |
£450,000 |
£1,300,000 |
189% |
|
Hillingdon |
980 |
26 |
3% |
£465,000 |
£1,242,500 |
167% |
|
Sutton |
945 |
19 |
2% |
£450,000 |
£1,120,000 |
149% |
|
Havering |
1,280 |
19 |
1% |
£410,000 |
£1,200,000 |
193% |
|
Croydon |
1,401 |
19 |
1% |
£425,000 |
£1,250,000 |
194% |
|
Waltham Forest |
1,119 |
11 |
1% |
£520,000 |
£1,160,500 |
123% |
|
Newham |
563 |
2 |
0.4% |
£425,000 |
£1,110,000 |
161% |
|
Bexley |
1,129 |
4 |
0.4% |
£400,000 |
£1,240,000 |
210% |
|
London |
28,210 |
3,050 |
10.8% |
£515,000 |
£1,302,250 |
153% |
|
|
|
|
|
|
|
|
|
Mid-prime market - £3m to £5m |
||||||
|
Location |
All Transactions |
Transctions between £3m+ & £5m |
£3m+ to £5m as % of all |
Average sold price - All |
Average sold price - £3m+ to £5m |
Price difference (%) |
|
Kensington and Chelsea |
508 |
55 |
11% |
£1,200,000 |
£3,800,000 |
217% |
|
City of Westminster |
561 |
46 |
8% |
£930,000 |
£3,575,000 |
284% |
|
Camden |
591 |
25 |
4% |
£762,000 |
£3,700,000 |
386% |
|
Hammersmith and Fulham |
612 |
11 |
2% |
£757,500 |
£3,470,000 |
358% |
|
Islington |
542 |
8 |
1% |
£650,000 |
£3,121,728 |
380% |
|
Merton |
779 |
11 |
1% |
£548,000 |
£3,875,000 |
607% |
|
Richmond upon Thames |
1,035 |
11 |
1% |
£692,500 |
£3,750,000 |
442% |
|
Southwark |
868 |
8 |
1% |
£567,500 |
£3,562,550 |
528% |
|
Wandsworth |
1,511 |
9 |
1% |
£662,500 |
£3,700,000 |
458% |
|
Barnet |
1,174 |
6 |
1% |
£610,000 |
£3,527,500 |
478% |
|
Hounslow |
635 |
3 |
0.5% |
£480,000 |
£3,500,000 |
629% |
|
Haringey |
700 |
3 |
0.4% |
£559,500 |
£3,879,000 |
593% |
|
Kingston upon Thames |
788 |
3 |
0.4% |
£546,000 |
£3,320,000 |
508% |
|
Brent |
580 |
2 |
0.3% |
£563,125 |
£3,425,000 |
508% |
|
Bromley |
1,768 |
4 |
0.2% |
£500,000 |
£3,466,667 |
593% |
|
Lambeth |
1,107 |
2 |
0.2% |
£560,000 |
£3,765,000 |
572% |
|
Hackney |
683 |
1 |
0.1% |
£582,000 |
£4,200,000 |
622% |
|
Tower Hamlets |
702 |
1 |
0.1% |
£510,000 |
£3,500,000 |
586% |
|
Greenwich |
882 |
1 |
0.1% |
£450,000 |
£3,235,000 |
619% |
|
Enfield |
931 |
1 |
0.1% |
£473,000 |
£3,850,000 |
714% |
|
Hillingdon |
980 |
1 |
0.1% |
£465,000 |
£3,950,000 |
749% |
|
Lewisham |
1,065 |
1 |
0.1% |
£490,000 |
£3,500,000 |
614% |
|
Croydon |
1,401 |
1 |
0.1% |
£425,000 |
£3,000,000 |
606% |
|
London |
28,210 |
214 |
0.8% |
£515,000 |
£3,650,000 |
609% |
|
|
|
|
|
|
|
|
|
Upper-prime market - £5m plus |
||||||
|
Location |
All Transactions |
Transctions above £5m |
£5m+ as % of all |
Average sold price - All |
Average sold price - £5m+ |
Price difference (%) |
|
Kensington and Chelsea |
508 |
54 |
11% |
£1,200,000 |
£7,675,000 |
540% |
|
City of Westminster |
561 |
31 |
6% |
£930,000 |
£7,500,000 |
706% |
|
Camden |
591 |
13 |
2% |
£762,000 |
£7,250,000 |
851% |
|
Merton |
779 |
4 |
0.5% |
£548,000 |
£5,823,750 |
963% |
|
Richmond upon Thames |
1,035 |
4 |
0.4% |
£692,500 |
£6,950,000 |
904% |
|
Haringey |
700 |
2 |
0.3% |
£559,500 |
£8,250,000 |
1375% |
|
Kingston upon Thames |
788 |
2 |
0.3% |
£546,000 |
£6,222,500 |
1040% |
|
Wandsworth |
1,511 |
3 |
0.2% |
£662,500 |
£5,685,500 |
758% |
|
Ealing |
812 |
1 |
0.1% |
£530,000 |
£5,545,000 |
946% |
|
Redbridge |
842 |
1 |
0.1% |
£490,000 |
£23,300,000 |
4655% |
|
Enfield |
931 |
1 |
0.1% |
£473,000 |
£5,750,000 |
1116% |
|
Barnet |
1,174 |
1 |
0.1% |
£610,000 |
£12,500,000 |
1949% |
|
London |
28,210 |
117 |
0.4% |
£515,000 |
£7,100,000 |
1279% |


