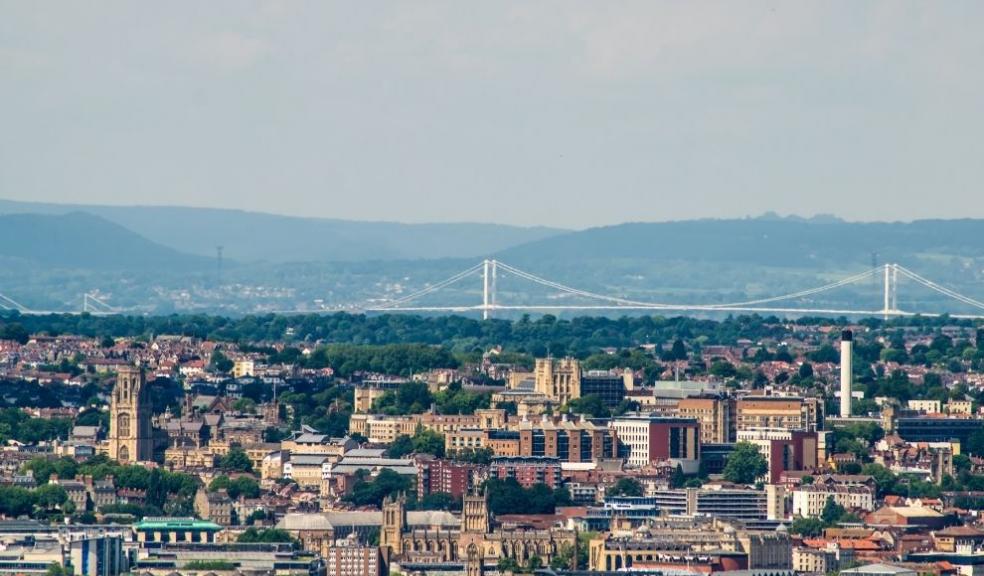
The cities where new build homebuyer demand has exploded
The latest research, by new build experts, BuildScan, has found that homebuyer demand for new build homes has climbed 9% in the last year, with coastal towns in the south of England and Wales leading the charge.
BuildScan’s New Build Homebuyer Index analyses the appetite for new build homes across 22 major cities in Britain, as well as the market as a whole. The index looks at demand for new build homes based on how many properties in each area have already been snapped up by homebuyers as a percentage of total stock listed for sale.
The index shows that across Britain, 38.7% of all new build homes are already sold subject to contract or under offer, a +9% increase on the same time last year.
Biggest increases in new build demand
When it comes to the biggest year on year increases, there is a clear trend for growing demand for new build homes along the south coast and Wales, in particular.
Portsmouth has seen the biggest increase in demand for new build homes, currently at 66% having jumped +46% when compared to this time last year.
Swansea has seen the second largest increase, up +42%, with Plymouth (+33%), Bournemouth (+32%) and Newport (+24%) also seeing a considerable jump in new build homebuyer demand.
Hottest spots for current new build demand
Bournemouth (81%), Swansea (74%), Portsmouth (66%), Plymouth (62%) and Bristol (54%) rank as the hottest spots where current homebuyer demand is concerned.
New build demand declines
New build demand hasn’t increased in every city though. Both Leeds (-7%) and Oxford (-4%) have seen demand fall compared to this time last year, while Newcastle and London have remained flat.
Founder and Managing Director of BuildScan, Harry Yates, commented:
“A number of current market indicators suggest that the new build sector is really helping to fuel the current housing boom, with both transaction numbers and house price growth showing a sharp uplift over the last year.
This is also clear when analysing buyer demand for new build housing with all but a handful of major cities seeing a notable leap in market activity. Although a degree of this demand is due to the current stamp duty holiday, it’s not unusual to see the appetite for new build homes sit consistently higher than that of the regular market.
We expect this will continue to be the case and as housebuilders struggle to keep pace with this high level of demand, prices are likely to keep climbing too.”
|
Location |
Current New Build Demand |
Annual Change (%) |
|
Portsmouth |
66% |
46% |
|
Swansea |
74% |
42% |
|
Plymouth |
62% |
33% |
|
Bournemouth |
81% |
32% |
|
Newport |
32% |
24% |
|
Cardiff |
30% |
16% |
|
Glasgow |
28% |
16% |
|
Southampton |
34% |
13% |
|
Bristol |
54% |
12% |
|
Liverpool |
16% |
11% |
|
Sheffield |
38% |
9% |
|
Cambridge |
44% |
7% |
|
Manchester |
17% |
4% |
|
Leicester |
20% |
4% |
|
Nottingham |
33% |
4% |
|
Edinburgh |
19% |
3% |
|
Birmingham |
20% |
2% |
|
Aberdeen |
1% |
1% |
|
London |
18% |
0% |
|
Newcastle |
7% |
0% |
|
Oxford |
21% |
-4% |
|
Leeds |
31% |
-7% |
|
United Kingdom |
39% |
9% |
|
Demand percentage is based on the number of homes already SSTC or Under Offer as a percentage of total stock in an area. |
||


